

Table of Contents
How Do the Economic Advantages of Tier 2 Compare to Tier 1 Indian Talent Hubs?
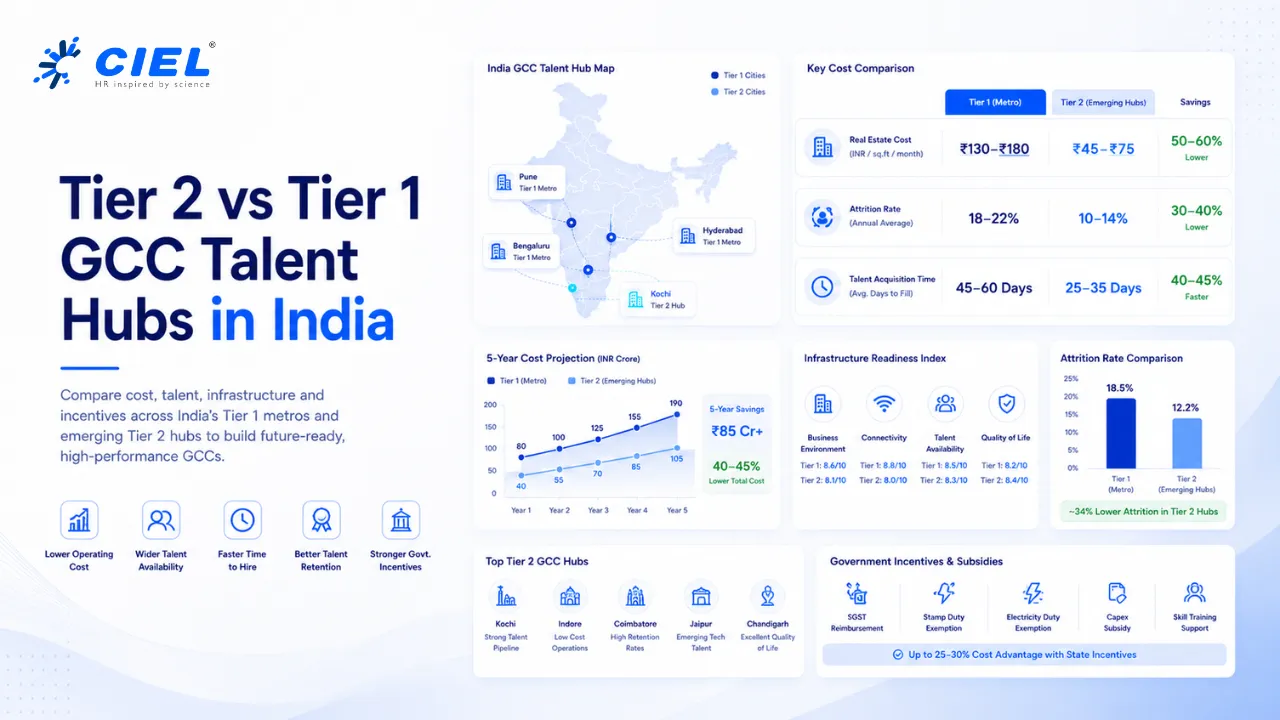
The economic advantage of establishing a Global Capability Center (GCC) in a Tier 2 Indian city versus a Tier 1 metro relies on optimizing total cost of operations through reduced real estate overhead and lower employee attrition. Tier 2 hubs lower facility costs by 30-40% and stabilize project delivery by cutting attrition from 25% to under 10%, generating sustainable long-term ROI despite initial infrastructure constraints.
What Is the Core Evaluation When Choosing Between Tier 1 and Tier 2 Indian Talent Hubs?
Geographic talent distribution models shift workforce concentration from saturated metropolitan centers to emerging regional hubs, reducing operational expenditure while maintaining delivery capabilities. This redistribution prevents vendor lock-in and mitigates the risk of hyper-competitive local labor markets.
Evaluating a Tier 2 versus a Tier 1 Indian talent hub requires analyzing the detailed total cost of operations breakdown for a tech team in a Tier 2 city versus a Tier 1 metro, rather than just comparing baseline salaries. The common evaluation approach falls short because procurement teams focus exclusively on immediate payroll arbitrage. This narrow view ignores the compounding costs of high employee turnover, saturated infrastructure, and escalating real estate leases in established Tier 1 ecosystems like Bengaluru, Pune, or Hyderabad. A comprehensive evaluation weighs the long-term stability of a regional workforce against the immediate availability of specialized legacy skills.
How Do Criteria and Frameworks Separate Successful Tier 2 Expansions From Failed Ones?
Talent hub evaluation frameworks measure regional infrastructure readiness, talent pipeline depth, and government incentives to determine the viability of a Global Capability Center location. This structured assessment prevents costly deployments in cities lacking the necessary ecosystem.
Successful expansions rely on a multi-dimensional audit of the destination city. Evaluating how lower employee attrition in Tier 2 cities impacts long-term project stability and training costs reveals that reduced turnover directly stabilizes product roadmaps. In Tier 1 cities, engineers frequently change employers for minor salary increments, disrupting agile sprints and forcing continuous onboarding. In Tier 2 locations, higher employee loyalty preserves institutional knowledge. Decision-makers assess how to structure compensation packages in Tier 2 cities to offer better purchasing power while optimizing salary budgets, ensuring that the total rewards strategy attracts top-tier engineers without inflating the baseline operational expenditure.
How Does a Tier 2 Evaluation Play Out in a Real-World Scenario?
Scenario-based evaluation models simulate operational conditions across different geographies, exposing hidden risks before capital is committed. This predictive approach allows operations leaders to adjust their deployment strategy based on empirical risk data.
A global fintech enterprise initiates a site selection process for a new 500-person engineering center. The initial scorecard heavily favors a Tier 1 city due to the immediate availability of specialized machine learning engineers. The operations team assumes that the established ecosystem accelerates the launch timeline, projecting a fully operational facility within six months. They budget for standard Tier 1 real estate rates and a projected 22% annual attrition rate, considering these acceptable costs of doing business in a mature market.
During the final risk assessment phase, the procurement and HR teams run a simulated five-year cost projection comparing the Tier 1 baseline against an emerging Tier 2 fintech hub like Kochi. The simulation reveals critical flaws in the initial assumption. While the Tier 1 city offers faster initial hiring, the projected attrition rate forces the company to replace and retrain 110 engineers annually. This constant turnover introduces severe project delays and inflates the training budget by $1.2 million over three years. The initial speed to market is completely negated by the ongoing maintenance of the workforce.
The evaluation shifts toward the Tier 2 hub when the team analyzes the hidden challenges or infrastructure risks of expanding into Tier 2 cities compared to the established Tier 1 ecosystem. They discover that while specialized talent takes 15% longer to source locally, the 8% attrition rate in the Tier 2 city ensures that institutional knowledge remains intact. The lower cost of living allows the company to offer a compensation package that provides higher local purchasing power while still reducing the overall salary budget by 22%. The decision pivots to the Tier 2 location, securing long-term project stability over short-term hiring speed.
How Does the Total Cost of Operations Compare Between Tier 2 and Tier 1 Hubs?
Total cost of operations analysis quantifies the financial variance between geographic locations by calculating real estate, payroll, retention, and infrastructure expenses. This financial modeling provides a definitive ROI timeframe for regional expansion.
Understanding which Tier 2 cities are emerging as hubs for specific industries like fintech, manufacturing, or deep tech requires a direct comparison of operational metrics. Beyond cost savings, evaluating how the availability of specialized skills like AI or R&D compares between Tier 1 and Tier 2 talent pools is critical for long-term capability planning.
| Evaluation Metric | Tier 2 Hub Approach | Tier 1 Hub Approach |
|---|---|---|
| Real Estate Costs (Class A) | $4 – $6 per sq ft / month | $12 – $18 per sq ft / month |
| Average Attrition Rate | 8% – 12% annually | 22% – 28% annually |
| Talent Acquisition Time | 45 – 60 days (General IT) | 30 – 45 days (Highly specialized) |
| Infrastructure Risk | Moderate (Requires power redundancy) | Low (Established enterprise grids) |
| Government Incentives | High (Subsidies, tax holidays) | Low to Moderate |
A rigorous site selection audit applies specific pass/fail thresholds to potential Tier 2 locations:
- Talent Availability Threshold: Local engineering graduate output > 10,000 annually = PASS. < 10,000 = HIGH RISK.
- Attrition Impact Score: Projected annual turnover < 15% = PASS. > 15% = FAIL (Negates Tier 2 cost advantage).
- Infrastructure Readiness: Dual-path fiber connectivity and > 99.9% grid uptime = PASS. Reliance on single ISP = FAIL. Action: Mandate secondary ISP and backup generation before lease signing.
- Skill Scarcity Metric: Time-to-fill for core roles < 60 days = PASS. > 60 days = HIGH RISK.
Evaluate your organization’s readiness for a Tier 2 Global Capability Center by applying an empirical site selection framework. Compare operational costs, assess regional talent pipelines, and determine the optimal geographic strategy for your next engineering hub.
What Are the Trade-offs of Expanding into Tier 2 Indian Cities?
Geographic risk assessment identifies the operational limitations of emerging talent hubs, mapping infrastructure gaps and specialized skill shortages. This proactive identification enables organizations to deploy mitigation strategies before launch.
Organizations must account for specific considerations before committing to a Tier 2 expansion:
- Specialized Skill Scarcity: Deep tech, niche machine learning, or legacy mainframe talent requires relocation from Tier 1 cities, increasing initial acquisition costs.
- Vendor Ecosystem Maturity: Local IT support, hardware procurement, and specialized legal services lack the enterprise-grade SLAs found in major metropolitan areas.
- Air Connectivity: International travel logistics are complex, requiring connecting flights through major hubs, which extends travel time for global executives.
- Power Redundancy Needs: Facilities require higher capital expenditure on uninterrupted power supply (UPS) systems and diesel generators to combat regional grid instability.
Ready to model the exact financial impact of a regional expansion? Start mapping your specific talent requirements against Tier 2 availability data to build a localized cost-benefit analysis.
Frequently Asked Questions
What are the technical infrastructure prerequisites for establishing a GCC in a Tier 2 city?
A Tier 2 facility requires dual-path enterprise fiber connectivity, N+1 redundant power systems, and secure VPN tunneling to corporate networks. Organizations must validate local ISP service level agreements to ensure they meet global uptime standards before committing to a lease.
How long is the typical ROI timeframe when transitioning operations to a Tier 2 hub?
Organizations achieve positive ROI within 18 to 24 months. While the initial capital expenditure for facility setup and redundant infrastructure is high, the 30% reduction in payroll and 50% drop in real estate costs offset the upfront investment.
How can a company structure compensation packages in Tier 2 cities to offer better purchasing power while optimizing salary budgets?
Companies utilize a localized purchasing power parity model, setting base salaries 15-20% lower than Tier 1 benchmarks while maintaining high lifestyle value for employees. Packages emphasize retention bonuses, comprehensive family healthcare, and long-term stock options over aggressive signing bonuses.
Which industries are best suited for Tier 2 expansion?
Business process outsourcing, core software engineering, and manufacturing IT operations thrive in Tier 2 cities. Industries requiring highly specialized, scarce talent like advanced generative AI research or high-frequency trading algorithms remain in Tier 1 ecosystems.
What specific government incentives and SEZ benefits can a company expect when setting up a GCC in an emerging Indian city?
State governments offer stamp duty exemptions, subsidized land rates, and power tariff rebates for facilities located within designated Special Economic Zones. Additionally, some regions provide direct payroll subsidies for hiring local engineering graduates.
